The Echo of Neighborhood Redlining on Present-Day Health, Wealth and Environmental Quality
Over 80 years ago, a US federal agency known as the Home Owners Loan Corporation, or HOLC, was given the authority to award grades from A to D to particular neighborhoods in cities throughout the country. Here in Virginia, Richmond, Roanoke, Lynchburg, Newport News and Norfolk received HOLC “residential security maps."
A neighborhood’s grade was related to that area’s perceived “safety” for financial investment, usually in the form of real estate mortgages and homeowners’ insurance. A-rated neighborhoods were outlined in green, and were deemed “hot spots'' for investment. D-rated neighborhoods, on the other hand, were outlined in red and were denied access to financial services from banks and lenders.
Why were some neighborhoods redlined? While HOLC assessors took into account the quality of the landscape; the types, age and condition of residential buildings; and the occupations of those people residing there, a residential security grade mostly reflected the racial and immigrant population of that particular neighborhood. Redlined, D-graded areas were "characterized by detrimental influences in a pronounced degree," or influences like Black, ethnic or low-income populations. A-rated neighborhoods’ inhabitants were listed as the “best people,” or predominantly White, wealthy families.
Redlining is one of the clearest historical examples of state-sponsored, systemic racism in US housing and economic policy. We can even read detailed notes about each HOLC-graded area in Richmond on the University of Richmond’s Redlining Richmond website, and look at maps and notes from other cities around the Commonwealth and the rest of the country in their Mapping Inequality database to explore just how the socially-constructed concept race intersected with perceived financial safety and security.
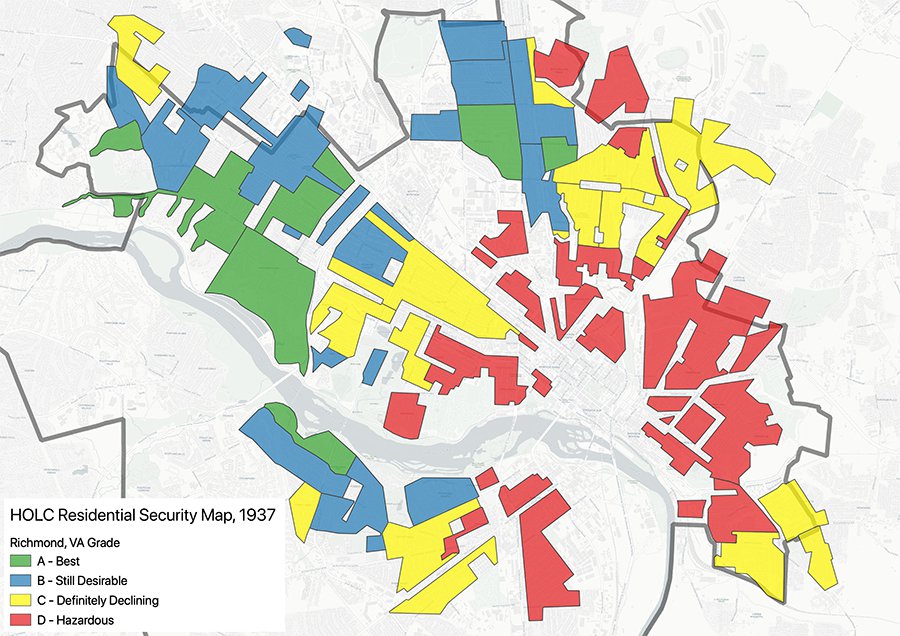
The boundaries of areas included in the 1937 Richmond HOLC Residential Security Map. The polygons were downloaded from the University of Richmond Digital Scholarship Lab website: https://dsl.richmond.edu/
While this practice was ultimately banned in the Fair Housing Act of 1968, its impacts are still playing out in neighborhoods across the country today. Formerly redlined neighborhoods of cities are consistently linked to lower home values and credit scores, inequitable leanding, lower annual incomes, higher Black and ethnic populations, fewer supermarkets and lately, more disparate health outcomes and climate change exposure.
In January, the Science Museum of Virginia published a study linking higher summertime land surface temperatures to formerly redlined areas in 108 US cities. Redlined areas of cities were shown to have significantly fewer trees than their non-redlined neighbors, allowing for more of the sun’s energy to get soaked up and amplified by human-built surfaces like roads and brick buildings. This temperature intensification, at a glance, might not seem like a big deal. But, higher temperatures in particular areas of cities can lead to more cost-burdened energy use and exacerbate heat-related illnesses. This month, the New York City mayor’s Office of Resiliency released a report on recommendations for building heat resilience in the city’s most vulnerable areas, citing the Museum’s work.
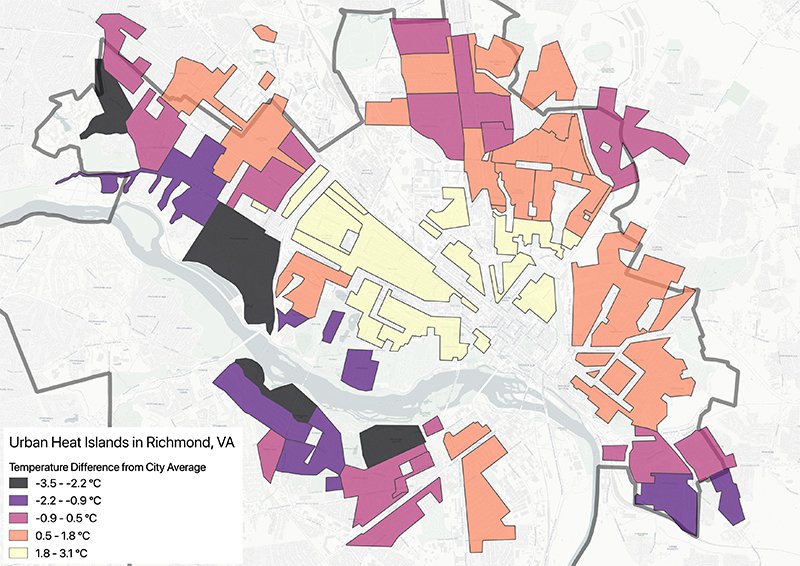
The summertime surface temperature difference between an individual HOLC polygon and the city-wide average. “D”-rated areas are now 2.6°C (4.7°F) warmer than “A”-rated neighborhoods in Richmond.
Closer to home, the City of Richmond’s emerging climate action plan, RVA Green 2050, as well as its next comprehensive master plan, Richmond 300, center on improving the health and quality of life for frontline communities in Richmond, which can have lasting and positive impacts even on those most sheltered and privileged communities.
A few weeks after the release of our study on urban heat, another study of formerly redlined neighborhoods in California showed that these areas experience higher rates of hospitalizations for asthma than their non-redlined neighbors. Why could this be? In many places, HOLC redlining maps served as a guide for where to demolish entire neighborhoods and to construct the national interstate system. The proximity of the remaining residents to these highways likely results in exposure to higher amounts of particulate matter (that is, tiny particles in the air produced from chemical reactions between tailpipe emissions, sunlight and other human-sourced emissions).
These findings ultimately underscore recent reports of higher rates of morbidity and mortality due to COVID-19, a respiratory disease worsened by underlying health issues like asthma and COPD, in communities of color here in Richmond and elsewhere. We suspect that scientific studies for many years to come will uncover similar links between redlining and health outcomes related to COVID-19. The Museum is now working on an Institutes of Museum and Library Services-funded project to analyze air quality at a hyper-local level in Richmond. You can join this effort at bit.ly/Join-RVAir.
In a follow-up blog, we’ll explore interesting hypotheses related to neighborhood sorting that may have set the stage for HOLC redlining to codify existing disparity into our cities. Until then, the Museum will continue to share stories and information about how science can inform and educate because we believe the first step to creating change that leads to equity is a better understanding of what contributed to the inequality we see today.
As a learning organization, the Science Museum of Virginia is committed to learning as much as we can to become a better organization. We will continue to look at what science can teach us and will be sharing things with you as we all learn together.


